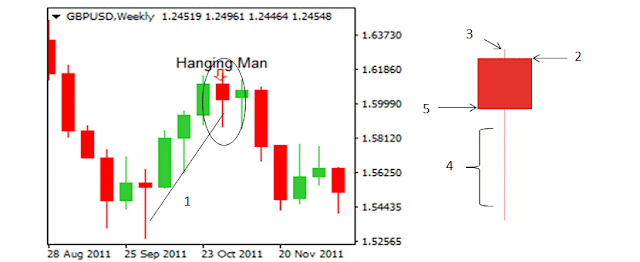
The hanging man is a bearish candlestick pattern that appears on a price chart and is used in technical analysis to signal a potential reversal in a stock or market trend. It is identified by a single candlestick with a small body, a long lower shadow, and little to no upper shadow. The pattern gets its name from its appearance, which resembles a hanging man.
The hanging man pattern is formed when the market opens, moves higher during the trading session, and then closes near or below the opening price. The long lower shadow of the hanging man pattern indicates that the price dropped significantly during the session, but was later bought back up by the bulls. The small body of the hanging man pattern shows that the buyers were not able to push the price up far enough, and the closing price was near or below the opening price. The absence of an upper shadow suggests that the bears were in control of the market during the session.
The hanging man pattern is a bearish reversal pattern, which means that it signals a potential change in the direction of the market from an uptrend to a downtrend. When the pattern appears on a chart, it suggests that the bulls are losing their control over the market, and the bears are beginning to take over. It is important to note that the hanging man pattern should not be used in isolation, but rather in conjunction with other technical indicators and analysis to confirm the potential reversal in the market.
Here is a detailed guide on how to use the hanging man strategy in trading:
Step 1: Identify the Hanging Man Pattern
The first step is to identify the hanging man pattern on a price chart. The hanging man pattern is characterized by a single candlestick with a small body, a long lower shadow, and little to no upper shadow. The pattern gets its name from its resemblance to a hanging man.
To identify the hanging man pattern, look for a candlestick with a long lower shadow that is at least twice the length of the body. The upper shadow should be small or non-existent, and the body should be located near the top of the trading range.
Step 2: Confirm the Pattern
Once the hanging man pattern has been identified, it is important to confirm the pattern with other technical analysis tools. Traders can use support and resistance levels, trend lines, moving averages, and other indicators to confirm that the hanging man pattern is indeed signaling a potential reversal in the market.
For example, if the hanging man pattern appears near a major resistance level, it can increase the likelihood that the pattern is signaling a potential reversal.
Step 3: Determine Entry and Exit Points
Traders should use the hanging man pattern as a signal to enter a short trade. The entry point is typically at the opening of the next candle after the hanging man pattern appears. Traders can also place a sell order below the low of the hanging man candlestick.
To determine the exit point, traders can use additional technical analysis tools, such as Fibonacci retracements, support and resistance levels, and trend lines. For example, a trader may choose to exit the trade when the price reaches a key support level.
Traders should also place a stop-loss order above the high of the hanging man pattern to limit potential losses in case the market does not behave as expected.
Step 4: Manage Risk
It is important to manage risk when using the hanging man strategy in trading. Traders should consider the size of their position, their risk tolerance, and their trading strategy when managing risk.
Traders should also monitor the trade and make adjustments as necessary based on changes in the market. If the market moves against the trade, traders may choose to exit the trade early to limit losses.
Step 5: Monitor the Trade
Finally, traders should monitor the trade and make adjustments as necessary based on changes in the market. It is important to stay informed about news and events that may impact the market and adjust the trade accordingly.
In conclusion, the hanging man strategy can be an effective tool for identifying potential reversals in the market. Traders should always conduct thorough analysis, confirm the pattern with other technical indicators, manage risk, and monitor the trade to make informed trading decisions.


EmoticonEmoticon